Comparing progress versus expectations using CASPA
CASPA’s flagship tool for the analysis of data is the Comparison of progress versus expectations screen, which gives you the analysis you need coupled with the flexibility you require to be able to compare progress versus expectations for any group of pupils, for any subject, and over any period of time for which data is available. CASPA’s Comparison of progress versus expectation screen can give you access to the top-level information you require for inclusion in your school’s SEF in just a couple of mouse clicks.
For a more detailed explanation of how CASPA derives its comparisons of progress versus expectations and guidance on interpreting analysis results, please refer to the Adobe Acrobat PDF document that can be downloaded by clicking here.
CASPA’s Comparison of progress versus expectations screen is an interactive query tool; the best way to appreciate what it can offer you is to download our free Evaluation Version of CASPA from our Downloads page and to try it yourself. However, some flavour of the reporting available is given below:
Analysing progress versus expectations
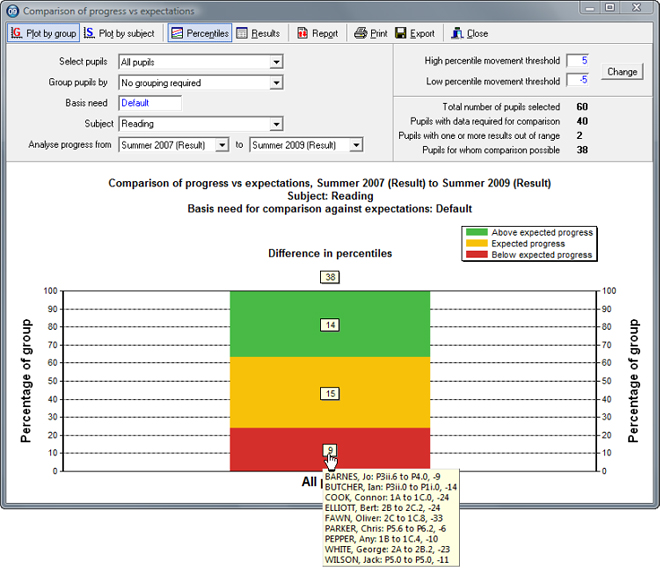
This example presents a ‘whole-school’ analysis of progress versus expectations; the user has selected all pupils to be included in the analysis, has selected Reading as the subject, and has chosen to analyse progress between Summer 2007 and Summer 2009. CASPA has responded by producing a single ‘traffic-light’ or ‘Red-Amber-Green’ graph showing the proportion of pupils making better than expected, expected and below expected progress.
The comparison of actual versus expected progress requires two things; firstly, that a measure of actual progress is available, and secondly, that expectations of progress for each individual pupil are available. For a measure of actual progress to be available, a pupil must have a result in the specified subject in both the specified start and end year and, for an expectation of progress to be available, appropriate comparative data, based on the age, category of need and level of prior attainment of the pupil must be available within CASPA’s comparative dataset, which is based on the analysis of anonymised data submitted by schools using CASPA. The numbers of pupils selected, the numbers of pupils with the requisite results and the numbers of pupils for whom expectations can be calculated are clearly identified on-screen.
The traffic-light graph represents, for those pupils for whom the requisite information available, the numbers of pupils who are progressing better than expected, as expected and worse than expected; in effect, CASPA is comparing the actual progress of pupils in our school against progress in a virtual school populated with exactly the same number of pupils with exactly the same combinations of age, category of need and level of prior attainment. By placing the mouse over any of the boxes representing the numbers of children in each category, we can instantly drill down to identify the individual pupils in that group, their starting and ending assessment levels and their change in percentile ranking over the period; alternatively, clicking the Report button will present the pupil-level data that is being summarised on-screen.
Click here or on the image below to open the report as pdf document to view and print.
Identifying differences between actual and expected progress
The traffic-light graph above tells us how many pupils are making above and below expected progress, but does not tell us directly by how much these pupils are above or below expected progress. By double-clicking a column on a graph it is possible to display a graph that clearly illustrates the spread of differences from expected progress for pupils in that group.
Click here or on the image below to open the report as pdf document to view and print.

Analysing progress versus expectations for groups of pupils
In our previous example, we presented a single ‘whole school’ analysis of progress versus expectations, with no additional grouping conditions. Whilst still including all of our pupils in our analysis, CASPA allows us to group our pupils by factors such as Key Stage, Year Group or Class, or by the types of identifier relevant to providing the information necessary for completion of our school Self Evaluation Form (SEF), such as gender, free school meals, children in LA care, ethnicity, etc.
An example showing the previous data grouped by entitlement to free school meals is shown below.
Click here or on the image below to open the report in a pdf document to view and print.

Analysing progress versus expectations by subject
In the examples above, we have seen analyses of progress versus expectations for a given subject over a given period for different groups of pupils. CASPA also supports similar analysis by subject or by aspect, where, for a given group of pupils and a given period, we can display our analysis results by subject or by aspect.
In the example below we can see, very quickly, that the proportion of pupils making below-expected progress in Science is markedly different to the proportion of pupils making below-expected progress in the other Core subjects. CASPA allows us to drill down instantly to identify whether this is down to an issue with the individual pupils, whether it is consistent amongst classes or year groups and whether it may represent an issue with provision of Science, or an anomaly with data highlighting the need for improvements in consistency of assessment and moderation.
Click here or on the image below to open the report in a pdf document to view and print.
