 So you have set targets and recorded them in CASPA. But how have you satisfied yourself that the targets are going to be appropriate for the pupil; challenging and realistic, and that for the whole school, they are going to reflect ambition.
You can use CASPA to help you gain confidence in your targets as soon as they are recorded…
Reviewing targets for individual pupils
Targets are not only specific to a pupil; they are often specific to each subject for a pupil (partly dependant upon the level at which they are working of course) and the amount of challenge you can build in to targets for a pupil may vary considerably from subject to subject. So it makes sense to start with the individual.
As soon as you have entered your targets, a great place to start is the ‘Progress vs percentiles’ graph (menu route: CASPA | CASPA assessment data, selecting the ‘Graphs and reports’ button (#1 star in diagram below) at the top of the page and then the right-hand tab (#2 star). Now click the ‘Show targets’ button just below the tabs (#3 star).
You are now displaying results and targets against the backdrop of the benchmark for the category of need. You have two key pieces of information to help you judge the quality of the targets; how the progress described by a target compares against:
- The pupil’s historic rate of progress
- CASPA’s expected progress
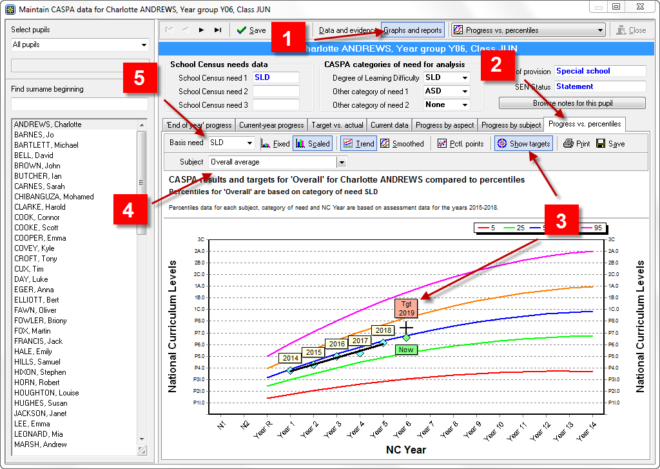 Initially, CASPA displays the overall average across all subjects. The subject drop down (#4 star) allows you to select each subject in turn (hint: select the field and use the down arrow in your keyboard to step through them if you find this easier).
‘Expected progress’ is based on the selected category of need which will be the Learning Difficulty if one is recorded, if not, Other need 1 is used or if neither has a need selected, CASPA will use Other need 2. The curves displayed, and therefore expected progress, will differ according to the need selected in the ‘Basis need’ drop down (#5 star). You can select any of the needs recorded for the pupil, and also ‘Ignore’ to define expected progress based on only age and prior attainment, ignoring category of need altogether.
CASPA’s ‘expected’ progress would require the pupil to remain on the same percentile curve. This does not include any inbuilt challenge; it is describing progress you might reasonably expect the pupil to make based on CASPA’s benchmarks which reflect the progress that other similar pupils make. In the absence of any other information about a pupil, a challenging target would be one that requires a pupil to achieve more than expected progress – they would move up to a higher percentile curve. This is where your professional judgement is essential. For example:
- If a pupil’s historic rate of progress has resulted in her moving up through the percentiles already, she has previously been making better progress than expected. Merely making expected progress would most likely be under-challenging for her
- If a pupil has never/rarely managed to achieve expected progress, even making expected progress may be a genuine challenge for that pupil
- You may also need to take other circumstances into account. For example, if a pupil is due to be out of school for a few months, this will naturally curtail what you can expect over the academic year
So target setting is not a science, but it is not a black art either. You need to take all of the available data and decide what is appropriate for that child. This graph is a great place to investigate whether targets appear to be adequate.
Reviewing targets at the whole-school level
If you are familiar with CASPA’s Traffic Light Graph, you may have looked at the green, amber and red bands and wished you had known in advance how many pupils would appear in each band. Good news – you can predict this before it becomes a fact (if pupils achieve their targets, that is).
Now that you have worked through each pupil and are happy that the targets are right for each, go to the Traffic Light graph (Reports | Comparison of progress vs expectations), choose a subject and analyse progress from last summer term’s result to the target for the end of this year (ie from Summer 2018 (result) to Summer 2019 (target) in CASPA 2019 as below). Click the ‘Plot by subject’ button (top left of screen) to view all subjects at once.
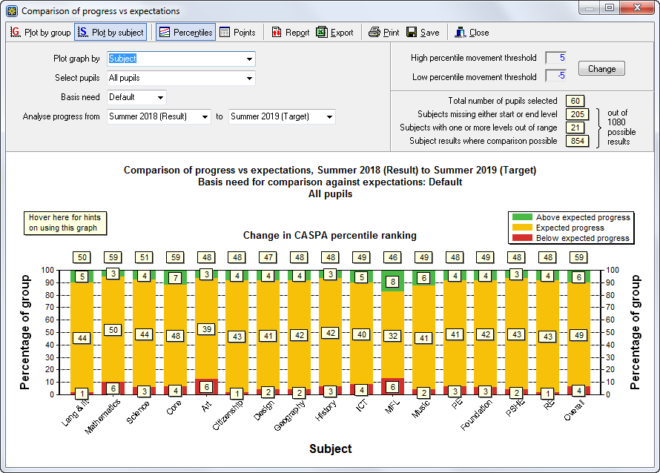 If this was your school’s graph and your pupils all meet their targets exactly, this is exactly how your Traffic Light graph will look at the end of the year when the summer term results are in. Are you happy that this is right? If you have pupils in the red band, you have targets that are below CASPA’s expected progress. If you have no pupils in the green band, you have no targets that will result in above expected progress.
If you want to investigate any pupils, hover over the chart marks to identify them, and if you wish to find out more, double click on the chart mark and right click on a pupil to either drill down to their main data entry pages or for detail reporting options. Click on the ‘Report’ button to display the details on which the graph is based.