 Have you ever wondered where your CASPA data for last year’s leavers can be found? CASPA doesn’t delete older data; it just, by default, displays data, and analyses progress, for this year’s on-roll cohort. There will, however, be occasions where you will want to analyse progress for pupils who were on roll in a previous year and CASPA can easily enable you to, effectively, turn back the clock.
Topic: Features
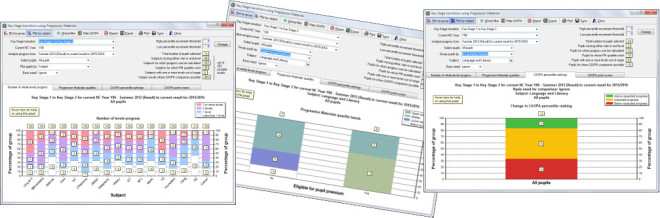
Key Stage reporting in CASPA
Posted in Analysing Attainment & Progress, FeaturesSchools need to be able to judge progress at many different levels – for individuals, groups of pupils and at the whole-schools level, and also over various periods of time – within a year, one years, more than one year, and across key stages. Key stage reporting has always, and remains the mainstay of discussions with external agencies such as Ofsted, advisors and SIPs, plus Governing bodies. Schools also want to compare progress against a range of expectations if possible, including CASPA’s benchmarking, levels, quartiles and compare actual progress and target progress against these benchmarks.
Life beyond levels
Posted in Analysing Attainment & Progress, Features, Managing DataUpdate: 14th April 2014
In the light of further information published by the DfE, along with other publications and analysis, there is more we can consider when asking what life will be like after levels.