Schools need to be able to judge progress at many different levels – for individuals, groups of pupils and at the whole-schools level, and also over various periods of time – within a year, one years, more than one year, and across key stages. Key stage reporting has always, and remains the mainstay of discussions with external agencies such as Ofsted, advisors and SIPs, plus Governing bodies. Schools also want to compare progress against a range of expectations if possible, including CASPA’s benchmarking, levels, quartiles and compare actual progress and target progress against these benchmarks.
It’s all in one place
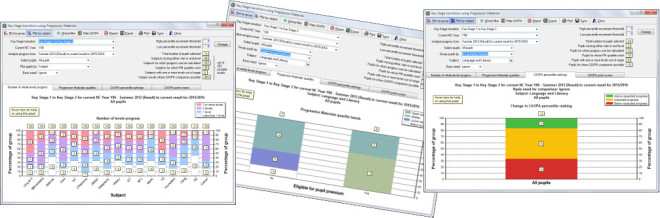
The single reporting option ‘Reports | Key Stage reporting using Progression Materials’ provides a suite of key stage reporting:
- Using CASPA’s benchmarking (traffic light graph), Progression Materials and by number of levels achieved
- For a single subject, all subjects and for groups of pupils (eg pupil premium, gender, first language)
- Allows you to drill-down to explore your detailed information
If you are already familiar with the traffic light graph, you will find it relatively quick and easy to make good use of this suite of reporting as the look and feel of the options, as well as style of reporting, are very similar.
For a quick tour of these CASPA features…
…take a look at a video clip that introduces CASPA’s Key Stage reporting using Progression Materials.
Simply make your selections for the key stage transition you are interested in, the cohort of pupils, the start and end year (if not pre-selected by CASPA based on other selections) and subject… and away you go. Two tabs will be displayed immediately catering for whole levels and quartiles analysis. Select the ‘Show CASPA’ button at the top of the page for CASPA’s traffic light graph.
Don’t forget to explore the grouping options to compare the progress of one group of pupils against others (eg Pupil Premium – click here for this example) whilst the ‘Plot by group’ button is selected (the default when opening this reporting). Also explore progress across all subjects, or aspects by clicking the ‘Plot by subject’ button. And for a detail report of the key data used in the report, select the ‘Report’ button.
The most frequent question we receive on this reporting, and the traffic light graph is probably to understand the numbers of pupils missing start/end levels or who have levels that are out of range. It is valuable to explore these as they explain why it is not possible to include these pupils within the graphs, but perhaps as important is to test whether you can reduce the numbers of pupils in both of these categories, as is often the case. Please click on the link in each bullet below to see two articles covering each of these in turn.
- Pupils who are missing a start and/or end level
- Pupils with levels that are ‘out of range’, or OOR in some reporting
Analysis comparing against Progression Materials and national expectations
‘Expected’ progress for pupils working in the NC Levels in Key Stage 2 was always regarded as making 2 levels – usually 3 levels for Key Stage 2 to 4. For pupils attaining below level 1 of the National Curriculum at the end of Key Stage 1 or 2, the starting point for evaluation was that expected progress is the median level, which referred to those published in the Progression Materials 2010-2011 document and associated data set 3.
CASPA provides a range of reporting:
- Number of levels progress achieved – Identify how many pupils made less than one level, 1 level, 2 levels, etc progress over the Key Stage
- Comparison against the Progression Materials quartiles – identify how many pupils achieved the median quartile, upper quartile, etc
- Transition matrices – display your school data in the same format as used in RAISEonline and Progression Materials to compare against
All of these can be found via Reports | Key Stage analysis using Progression Materials. Use the F1 key to open CASPA’s help system for details.
A few other features to highlight are:
- The features you are used to in the Traffic Light graph such as hovering over marks to identify pupils, drilling down through this hover list, etc are also available in this Key Stage analysis
- For the pupil-level details, click the ‘Report’ button at the top of the page or right click on a chart bar for options.
If you are wondering how CASPA’s expecations compare to the Progression Materials expectations, take a look at a related article on precisely this topic. Click here
Comparing achievement using CASPA’s benchmarks
CASPA’s benchmarks can be brought into the discussion by including the Traffic Light graph by clicking the ‘Show CASPA’ button at the top of the page. When you ‘Show CASPA’ new tabs appear to display your Traffic Light graph, ignoring need (rather than using the normal ‘Default’ need) to adhere to Ofsted’s preference for not taking need into account.
If you display the detailed pupil-level report (Reports button at the top of the page) now, you will add the CASPA details alongside the Progression Materials details.
If you feel it is appropriate for some or all of your pupils, you can change the ‘Basis need’ selection from ‘Ignore’ to ‘Default’ to display the Traffic Light graph taking category of need into account.