In general terms, ‘out of range’ refers to results for which a statistically meaningful comparison cannot be made. It is all about CASPA taking its responsibilities about comparisons seriously; you will not find CASPA comparing your pupils against a data sample of just one, or even a few dozen pupils!
Out of range is sometimes abbreviated to OOR and there are two main reasons for a result being classified as OOR:
- A result that is too far above or below the statistically reliable range for the selected need
- A result for a year group where there is insufficient data to make reliable comparisons for that need
Above or below expected range
CASPA calculates expected progress based on it’s extensive data set which is based on the data CASPA users submit to us at the end of the year (more details within CASPA via ‘Help | Guidance notes | CASPA’s comparative data’). However, for any particular category of need, results that are at the extreme lower or upper end of the range will be fewer in number and will eventually be so small in number that it would not be reliable to compare against. At extreme percentiles (the lowest and the highest), CASPA has to regard the volumes of data too small to use with any degree of reliability.
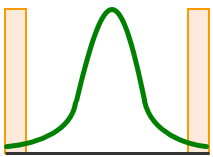
 This diagram (right) describes a typical bell curve representing results for a subject/year group/category of need combination with the lowest levels (eg P1i) on the left and the highest levels on the right. The largest volume of data is in the middle whilst the shaded areas tend to contain very small numbers of records. Note that this is an illustration only and does not aim to describe real data.
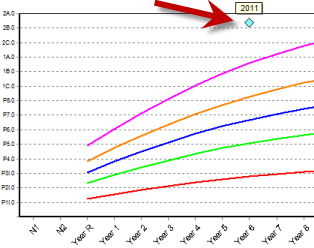
In CASPA, this is perhaps easiest to visualise when viewing a percentile line graph and an out of range result would be one significantly above, or below, the percentile curves displayed.
 For example, it would be extremely unusual to find a Year 6 SLD child working at level 2B in Reading (right); not impossible, but so rare that there may be insufficient pupils to compare against.
It is possible that a small amount of data was returned for pupils working at this same level, but to compare your pupil against a small handful would not be statistically significant or reliable, and CASPA only makes reliable comparisons.
So, what might you do? In the example above, assuming the result recorded is correct, most schools would be looking at the CASPA category of need used for analysis. This pupil may compare more meaningfully to MLD pupils, or perhaps has other needs that are more dominant in Reading; for example, the ASD benchmarks identify that this result would be well within range for ASD pupils.
For some pupils who are working at higher levels, simply ignoring category of need, which uses a benchmark covering all pupils regardless of need, will enable comparisons to be made.
Insufficient data for a year group
There are certain combinations of year group, subject and category of need that provide volumes of data that are either too small to be statistically meaningful, or the volumes of data available for each year group differ too much to compare against each other.
For all nursery year groups, there is insufficient data available to compare progress. For some low occurrence needs (eg MSI), there is data for Core subjects, although not for every year group, and insufficient data in all year groups for some Foundation subjects
In most cases, it is not that no data is available, but to describe statistically meaningful benchmarks, there must be a reasonably consistent set of data in each of the year groups to describe meaningful progress.
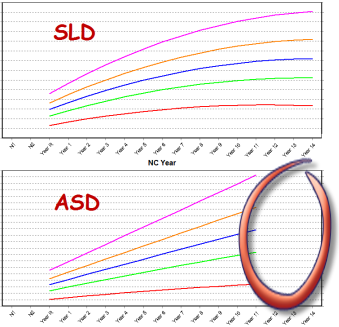
 If you compare the percentile graphs for SLD and ASD pupils, one of the obvious differences is that the curve for SLD pupils extend to Year 14 whilst the curves for ASD pupils finish at Year 11 (circled area, right).
When we analyse the data returned to us, it is apparent that there is a large difference in volumes of data for ASD pupils after Y11 from that recorded up to Y11. Instinctively we know that a proportion of more able pupils are not assessed in P Scales/NC levels after Y11. Some may also go on to further education, employment, etc so the cohort is not only different in size, but it is also different in makeup as the data for a large number of the more able pupils is no longer part of the overall data available in these later years.

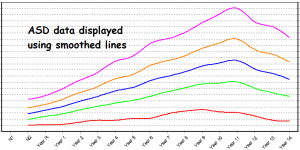
You can see this yourself by looking at the smoothed curves (right – instead of the trend as used by default and seen above) when pressing the ‘Smoothed’ button just above the Progress vs percentiles graph. This will display the full comparative data in the data set.
The ‘trend’ displays the data that is statistically most reliable – you can see the difference between merely comparing against all data versus comparing against a statistically meaningful set of data. This is what we mean by CASPA taking it’s responsibilities seriously.
This change in data volumes is seen especially for MLD, BESD and ASD cohorts and also for certain other needs, whereas the PMLD and SLD groups remain relatively stable up to Year 14, allowing the benchmarks to extend further.
In summary
As we have seen, CASPA only makes a comparison if it can make a reliable comparison. Identifying that a result is out of range may cause you to re-check the result and possibly to review the needs used for comparison.
Remember that this is not static – as more data is submitted each year, the volumes that are statistically acceptable result in an increased range of levels being reliable. It is therefore important that schools ensure their data is submitted to us at the end of every year – the benchmarks will expand to include this data within the range of expected levels. Every schools’ data makes a difference.
