 Have you ever wondered where your CASPA data for last year’s leavers can be found? CASPA doesn’t delete older data; it just, by default, displays data, and analyses progress, for this year’s on-roll cohort. There will, however, be occasions where you will want to analyse progress for pupils who were on roll in a previous year and CASPA can easily enable you to, effectively, turn back the clock.
So why might you want this older data (I hear you ask)? There are many reasons why this is useful, and sometimes essential; here are a few to get you started:
- You’re now in the autumn term and want to review whether pupils met their targets at the end of the summer term. This should not only be a review for pupils still on roll, but also for those who left last summer.
- Track the success of school improvement initiatives. CASPA’s analysis quite possibly illustrated the original issue via one of the reports and graphs. Re-run the report for each year in turn and witness the change from the original issue to an improved or resolved position.
- Compare progress for different on-roll cohorts. Has the whole school picture for achievement in, say, Reading changed over each the last three years?
- You are in the autumn term and you have realised you forgot to record results for pupils who left last year. You can import or manually edit data for pupils who were in CASPA in previous years, even though they are now no longer on roll.
CASPA is designed to provide you with a wide range of reports and graphs, and many other features, to use with the pupils who are on roll in the current academic year. Any analysis you can do with this year’s pupils, you can do for pupils whose data was recorded in CASPA in previous years.
So, how do you turn back the clock?
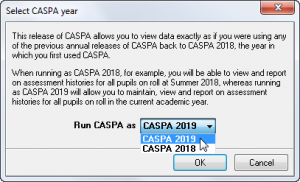
Firstly, this is something you can do as long as you had recorded data in CASPA in previous years. If you did, you will have the menu option enabled to select Options | Set CASPA effective year which will display the selection dialog as below.

When you select the dropdown, you will see a list of CASPA years for as many years as your CASPA installation has been used, possibly going back as far as CASPA 2008! The example installation above started life as CASPA 2018 and then updated this year. Select the year you are interested in to analyse attainment and progress for the pupils who were on roll in that summer term.
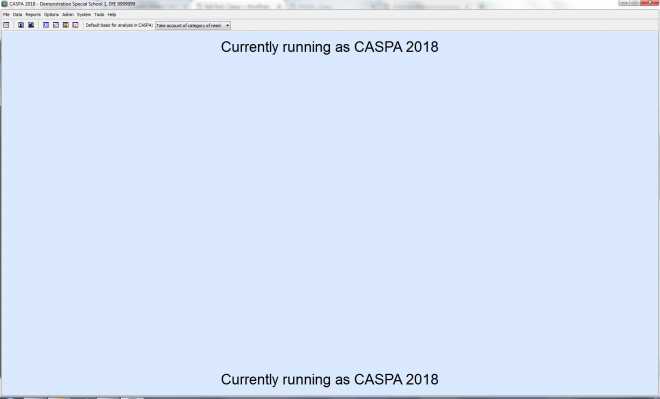
CASPA clearly displays which year you have chosen for analysis; CASPA 2018 was selected in the example below.

You now have all of the features available to the version of CASPA that is running (eg CASPA 2019), that you can now use to analyse attainment and progress for data from a previous year. In addition to being able to use all of the reports and graphs, you can also import/update data for pupils who are no longer on roll but who were in CASPA in this previous year.
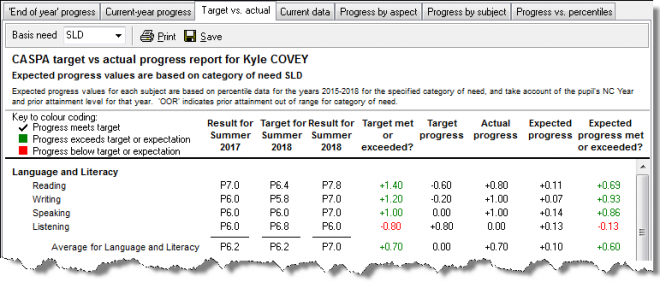
As you can see below, I am now able to use the ‘Target vs actual report’ for the data that would have been used in summer 2018 to consider whether Kyle met his targets for summer 2018, or not.

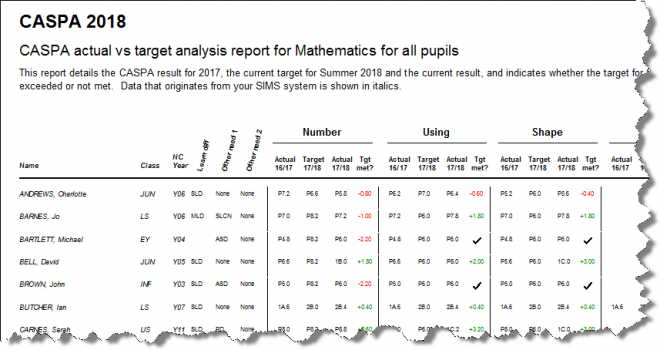
You will use the report above to investigate the detail for each pupil in turn. But if instead, you want subject-focussed, rather than pupil-focussed, analysis, you can carry out a review of target success for a subject, or group of subjects, for a group of pupils (such as a year group, class, or perhaps all pupils), In this case, use the equivalent report for groups of pupils; menu option Reports | Reports and graphs about groups of pupils, select the ‘Target vs actual analysis 2017-2018’ from the top dropdown menu. Note that the academic year (2017-2018 in the example above) is determined by the CASPA year selected; CASPA 2017 analyses 2016-2017, CASPA 2016 analyses 2015-2016, and so on. See an example below of the type of report output you can obtain; Maths was selected as the subject in this example…

In this report for groups of pupils, you also have a range of other selections you can make. Press F1 whilst making your selections to access CASPA’s context sensitive help system for more information on using this report selector and on using this, and other reports and graphs.
