 We know that for most CASPA users, this feels like the instinctively wrong thing to do. And don’t worry, we’re not removing any features from CASPA that allow you to compare your pupils against those they most meaningfully compare to (in fact, we are looking at doing more of this, not less). However, when it comes to inspections, you need to be prepared to consider progress using a variety of factors to meet the needs of Inspectors whilst also adequately portraying the real achievement of your pupils.
The new Ofsted framework (Jan 2012) provides clarity about your use of CASPA analysis during inspections. Here are a couple of key elements that are particularly relevant to this article:
- You absolutely must be able to determine how your pupils have progressed compared against the Government’s Progression materials previously published in National Strategies’ Progression Guidance and now beginning to become available in RAISEonline.
- “Inspectors should take account of … any robust attainment and progress data and its analysis presented by the school, including information presented by extermal organisations.” [The evaluation schedule for the inspection of maintained school and academies. Ofsted, Jan 2012, Ref 090098]
How do you use your CASPA analysis in this context?
So the Ofsted framework is quite clear that if you have your own robust analysis, it is valid to use it during an inspection; this will clearly be your CASPA analysis. In this context, it is perhaps easiest to start by summarising the way you might describe achievement for your school during an inspection as follows:
- Prepare for discussions that will start by using Progression Guidance data. This is based on End of Key Stage data, using whole levels only, for core subjects. Do not attempt to avoid this discussion.
- Extend these discussions to include your own CASPA analysis. Start by ignoring category of need to use the same principles used in the Progression Guidance
- Prepare to extend these discussions further for groups of pupils, or all pupils, along the lines of “If you’re interested, I can include need to illustrate…” using your traditional CASPA analysis, comparing pupils against their natural benchmark cohorts
When ignoring need, you are able to do the following, which are impossible with Progression Guidance data:
- Make comparisons against CASPA’s extensive data set (see Help | Guidance notes | CASPA’s comparative data for information about CASPA’s data set)
- Describe attainment and progress for all pupils in your school, not just those at the end of a Key Stage
- Illustrate all subjects that you assess (not just core subjects) to provide a rounded view of achievement
- Using the finer detail you have from your assessments, showing progress within a level (not just at the whole level), and year-on-year (not just start and end of a Key Stage)
How to ignore category of need?
This is very simple to do, and can be done for a specific graph/report, or for all analysis. When you ignore need, you are no longer comparing each pupil against those with the same categories of need, you are comparing them against the whole of CASPA’s comparative data set; all pupils, regardless of need. This is obviously a much larger set of data, includes pupils with all needs, and as such, describes progress for each pupil based on their age and from their prior attainment (or starting point). It no longer takes any account of the needs recorded in CASPA.
For individual pupils
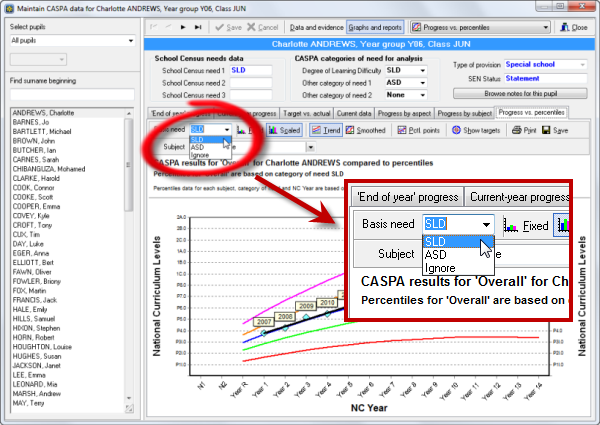
We’ll look at three examples. Firstly, let’s take the ubiquitous Progress vs percentiles graph in which you normally choose the most meaningful need for a pupil, sometimes a different need for different subjects by selecting the ‘Basis need’ dropdown (highlighted below).

To ignore need and use just age and prior attainment, select ‘Ignore’. You will immediately see the change in the benchmark’s percentile curves and can toggle between them to illustrate the difference. You can do the same on the other graphs/reports for individual pupils, and on the tabular reports, the ‘Expected progress’ column details the different amount of progress expected for each need, or when ignoring need.
For groups of pupils and at the whole school level
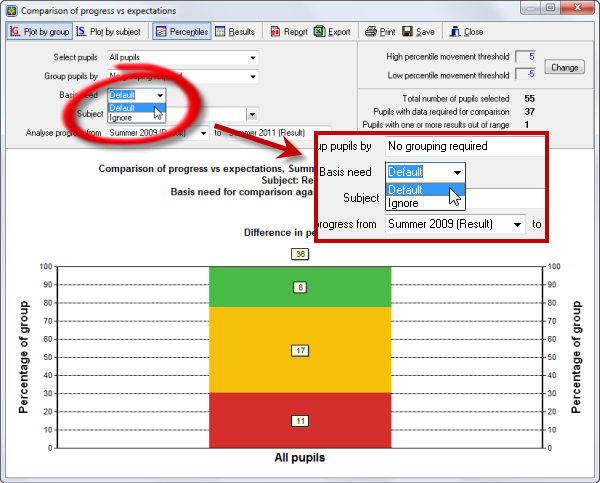
The example above caters for analysis for individual pupils. When you carry out analysis for groups of pupils or for whole school analysis, CASPA gives you two options initially – to use the ‘Default’ basis need, or to ‘Ignore’ need. The example below illustrates how this appears in CASPA’s traffic light graph – other group/whole school analysis works in the same way.

To ignore need and use just age and prior attainment, select ‘Ignore’.
For clarification, ‘Default’ uses a set of rules that are applied to each pupil. ‘Default’ will use the Degree of Learning Difficulty, if a pupil has one recorded. If not, CASPA will use the Other Need 1 recorded, and if neither fields have needs recorded, CASPA will use Other Need 2. If no needs are recorded for analysis in CASPA, the analysis will ignore needs and compare the pupil against all data in CASPA’s comparative data set, effectively doing the same thing as if you selected ‘Ignore’ for that pupil.
To ignore need throughout
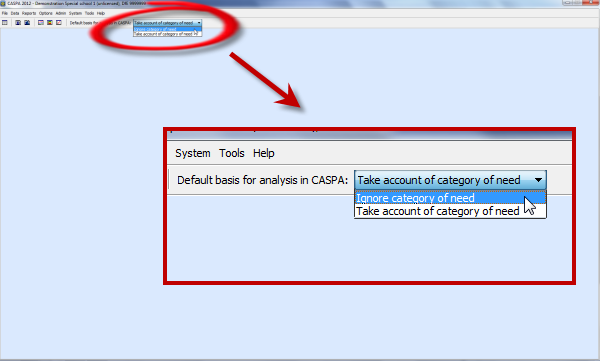
If you are carrying out a batch of analysis specifically ignoring need, you might find it handy to set ‘Ignore’ as the basis need for all of your analysis in one go. This avoids any need to remember to select Ignore in each graph or report. You can do this from CASPA’s main page as seen below.

Selecting this option from the toolbar (above) will set all analysis to ignore category of need, disabling the ability to select other needs. This setting will remain in effect until you either go back to reselect ‘Take account of category of need’ or close CASPA, and only affects your use of CASPA; other users logged in at the same time will see CASPA normally (taking need into account).
