 As soon as you’ve entered your summer term results, you’ll want to analyse attainment and progress. It is also important that you export your data to be included in the update to CASPA’s comparative data set before the summer holidays.
But before you leap, you’ll want to have confidence in your analysis and the data you export, so why not give the data you enter a health check using tools that CASPA has to help you with this.
You probably carry out your own levelling and moderation activities, and we wouldn’t want to get in the way of any of this. However, CASPA can supplement these activities quickly and easily with just a few reports which help you to:
- Confirm that pupils assessed at the same level, are really all working at the same level
- Spot pupils working at levels that are inconsistent with their category of need
We’re going to take a brief look at these reports, all found under Reports | Graphs and reports about groups of pupils and which help you to check various aspects of your data.
Improve confidence in your assessment results
You need to have confidence in your assessment data. One of CASPA’s reports is used widely to support moderation activity, helping schools to spot where pupil’s results do not seem correct. Go to Reports | Reports and graphs about groups of pupils, select ‘Current ranking report for selected aspect’.
This example is for Reading; pupils are grouped by the level assessed.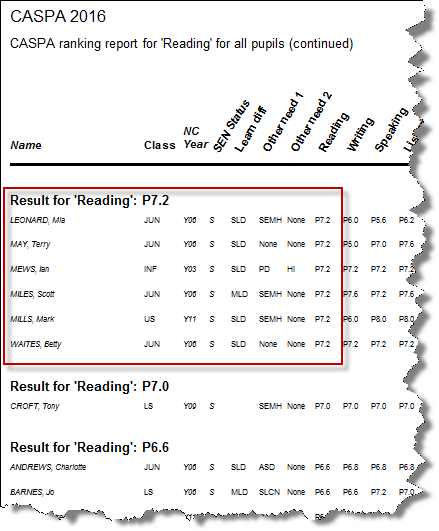
The pupils highlighted may be in different year groups, classes, etc but the common factor is that each has been assessed at the same level . So if you were reviewing these, perhaps with a subject leader, and a pupil stands out from the others as really working at a different level, you will have quickly identified an inconsistency in the data for that pupil.
This report has weeded out genuine inaccuracies in schools, saving valuable time and giving confidence by preventing inaccuracies which would otherwise have affected analysis of attainment and progress.
Out of range pupils
Occasionally, we receive data for pupils that just doesn’t ring true. An extreme example is pupils categorised as PMLD with results at NC level 4. If we have no opportunity to query it before schools break up for the summer holiday, we are unable to determine whether the results, or the category of need were incorrect, and would usually need to remove this data from the data we can use to update CASPA’s benchmarks. CASPA would certainly identify this pupil as ‘out of range’.
Your data is valuable and should play an important role in representing your pupils in the updated benchmarks, so you will want to ensure that you don’t have pupils whose results cannot be used, even though it may not be as extreme as the example above.
In CASPA ‘out of range’ usually identifies a pupil who is working at a level significantly higher or lower than the benchmarks predict. If we think about the percentile line graphs in CASPA, these would be pupils working well above the 95th percentile line or well below the 5th percentile line.
If you have pupils working beyond these expected levels, it is first worth confirming that the data is correct. You can identify pupils working above the 95th percentile or below the 5th percentile simply with two reports. Go to Reports | Reports and graphs about groups of pupil. The two reports we’re interested in here are ‘Current result exceeds 95th percentile report’ and ‘Current result below 5th percentile report’.
Running the ‘Current result exceeds 95th percentile report’ will display a report listing the pupils with results above the 95th percentile, displaying the results just for those subjects that meet this criteria, as per the example below.
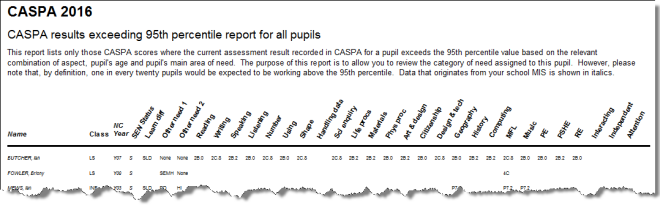 The ‘Current result below 5th percentile report’ works in exactly the same way, except that it highlights the results for pupils which are below the 5th percentile
The fact that a pupil and his/her results are listed here does not automatically make them out of range – the thresholds for ‘out of range’ are always a little further above the 95th or below the 5th percentiles, but these pupils are either working close to the extremes of expected levels, or are working beyond them. Most schools will find only a few pupils listed in these reports so they serve the purpose well of highlighting a small number of pupils that can be checked easily.
Where a pupil is outside of the normal range of expected outcome levels for their need, and you are confident that the data is accurate, it’s inclusion in data submitted to us will provide an opportunity to expand the range of expected levels in the subsequent update to CASPA’s comparative data.
Summary
In this article, we have explored some simple reporting in CASPA that quickly provides you with focussed intelligence to help you identify data that is, or may be, an anomaly. Use this at any time of year, but especially before you carry out critical analysis or export your data.