When we’re asked to come and spend time in schools, one of the first things we do on arrival is take a quick tour of the school’s data. It is quite common that, by the time we leave at the end of the visit, there are a few actions for the school to carry out, none of which are difficult, but all of which will make a massive difference to the school’s reporting.
There is no reason why you shouldn’t do the same quick checks that we carry out. It is astonishingly easy, won’t take long, and may well prove to be one of the most important things you can do in CASPA today!
Let’s start with the detail
Reporting for the whole school, or for groups of pupils, is all based on an aggregation of each pupil’s detailed data. So it makes sense to start here; if you have confidence in the detail, the higher level reporting begins to take care of itself.
You cannot overuse the ‘Progress vs percentiles’ report
In the space of only a couple of minutes, this report can tell someone all they need to know about progress in your school. Granted, external agencies are generally steered towards the ‘Traffic light’ graph, but if you want to open the bonnet and really see what you’ve got, there is no better place than this report.
The menu route is Data | CASPA assessment data, click the ‘Graphs and reports’ button at the top of the page, and select the right-hand tab ‘Progress vs percentiles’.
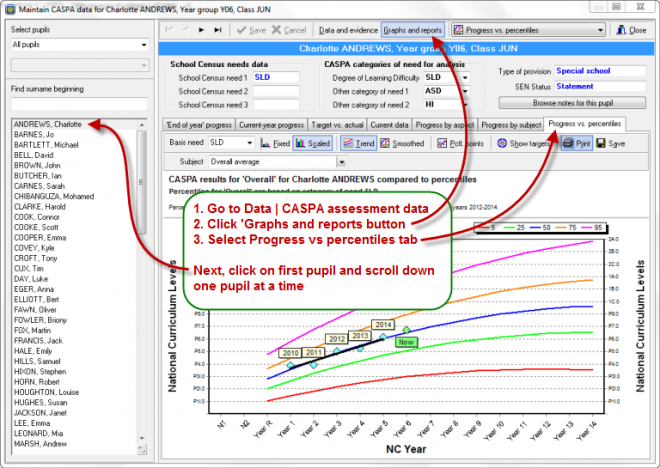
To begin with, leave the subject as the overall average. You will see immediately whether the graph looks sensible, and whether it reflects what you might expect for the child. Now select the next child, then the next, and so on. As you scroll down the page, you probably need a matter of only a few seconds per child to spot anything that deserves further investigation. What sort of things might you find, if there are any problems?
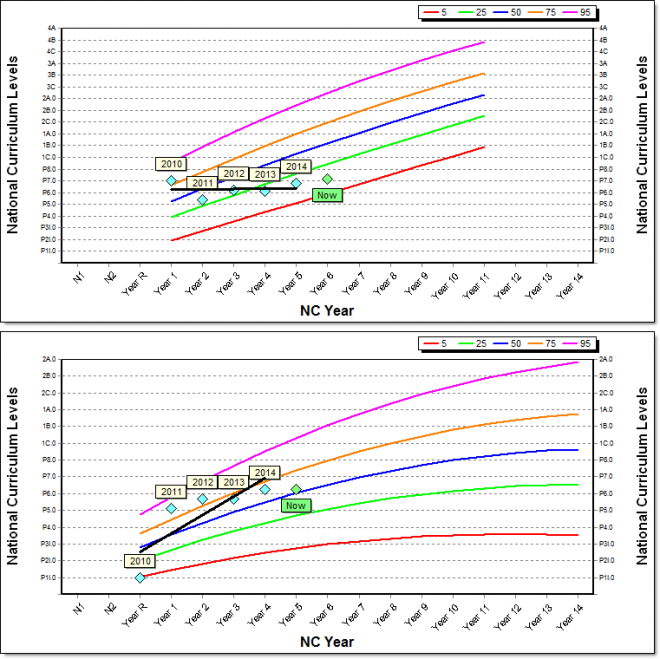
In the first example below, we have a pupil whose earliest result looks, certainly with hindsight, on the high side. Perhaps this result was provided by a previous school, or are the school’s own, but before the school had really got to know the child. In the second, this would probably be a school that used B Squared and didn’t set a baseline correctly, resulting in the lowest incomplete level being exported.
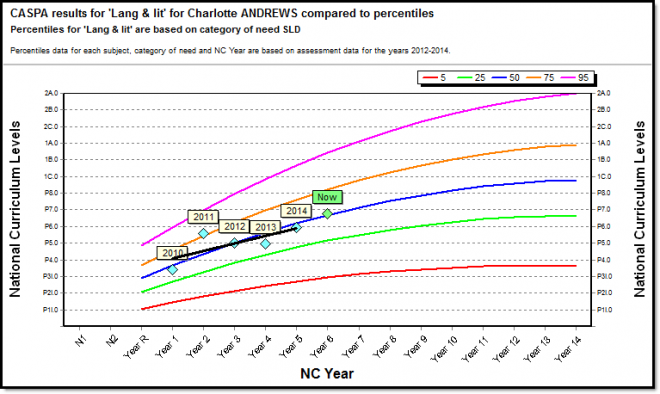
Next, for a pupil, try selecting each subject in turn; once again, using the arrow key after selecting the subject dropdown to make it easier. You might think this could be time-consuming, but you might give this task to each class teacher to do for their pupils, and/or might focus on core subjects. What this looks for is where assessments in one subject are suspect, but which might have been hidden amongst an overall average. The example below is exactly the same child as the first image in this article (the one with the text box and arrows), which was an overall average. So… what happened in in 2011?
What would you do about these? Once you have decided what the assessments should be, any that need changing are, if you use an assessment system, best corrected in that system and CASPA updated with a fresh export from that system. Otherwise, you can always correct data in previous years via Data | Advanced tasks | CASPA historic data.
So that is a quick way of checking that your data is of good quality. What about other types of data that will enhance the types of reporting you can carry out in CASPA?
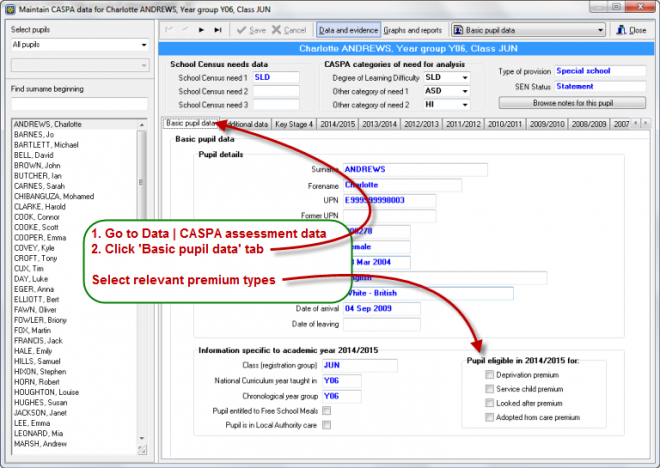
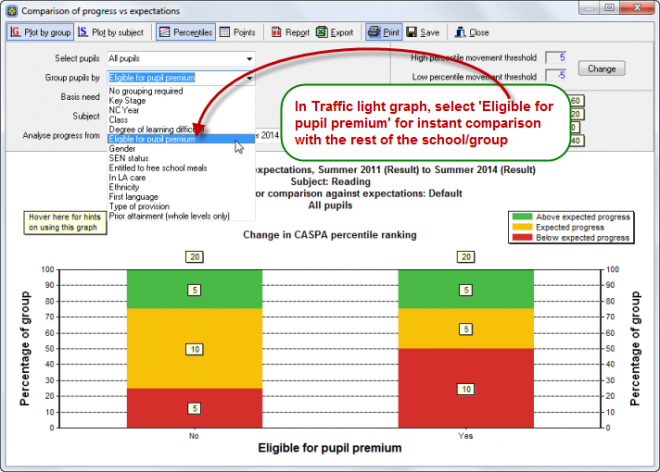
How’s your Pupil Premium reporting looking?
Reporting by Free School Meals eligibility, etc is not the same as Pupil Premium because the measures are significantly, if perhaps subtly, different. You have been able to record each pupil’s eligibility in CASPA since September. Do this and you instantly have extended Traffic light graphs and Key Stage reporting because one of the grouping options available is ‘Eligible for pupil premium’. It really is that simple.
Do you have as much prior attainment as you need?
We’re often asked about how far back data should be recorded. This depends upon your school and is often linked to key stage reporting and the expectation of three years of reporting. For example, if your school is a Secondary school and you want three years of key stage reporting across the secondary phase, this generally means:
- Last year’s Y11 for whom the start year (end of KS2) is 2009 and the end year is 2014
- The previous year’s Y11 for whom the start year is 2008 and the end year is 2013
- The Y11 cohort before the one above, for whom the start year is 2007 and the end year is 2012
This can seem a little daunting, but if you have been using CASPA a while, the data will already be there, whilst for newer users, you can make a decision about how far you go back based on the pupils you cater for and understanding what reporting you need.
Missing start and end levels
In CASPA’s Traffic Light graph and Key Stage reporting, you will often have pupils who are missing start and/or end levels. This is likely since, for example, if you analyse progress from 2009 to 2014 you will almost certainly have pupils on roll now who were not on roll in summer 2009. If they don’t have a 2009 result recorded in CASPA, those are ‘missing start levels’.
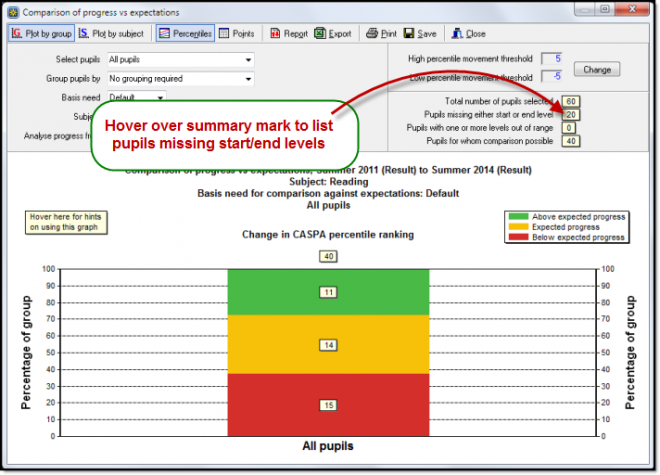
When you hover over the summary mark, ask yourself two questions:
- Were any of these children on roll in the start year? If yes, you must have their data somewhere. If in an assessment system, transfer it to CASPA, or manually input via Data | Advanced tasks | CASPA historic data
- If no, did any of the pupils arrive in the following September. If so, most people would use the baseline recorded in the first weeks as reasonably close to where the pupil would have been at the end of the previous summer. Record the baseline from September as the previous summer result via via Data | Advanced tasks | CASPA historic data
Doing this simple activity is a one-off task, and plugs gaps in, especially, your Key Stage reporting very quickly.
Going forward, make sure all baselines for your September admissions are recorded in CASPA as their ‘current result’ during the autumn term and let CASPA automatically copy it back to the previous summer, thereby eradicating gaps in your data in the future.