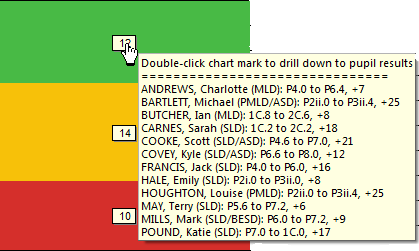
 The ‘Comparison of progress vs expectations’ graph is probably in the majority of users’ top two CASPA reports and graphs. So it is not surprising that we receive a lot of feedback on things that users would love to see added to it’s features.
These have been pretty complicated to develop, but we have enhanced this graph to include most of these in ways that we think will exceed your expectations!

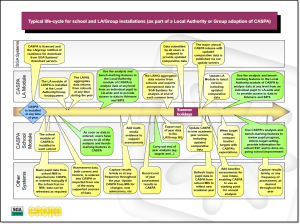
 So, what does a year in the life of using CASPA look like? Do you use CASPA once each year, twice, or at key times throughout the year?
 We would hope that you don’t find the job of recording your results in CASPA a difficult or time-consuming one. We would usually expect that if you find it a chore because it takes a long time, CASPA has other options that would make it easier for you.