CASPA makes an extensive range of analysis and reporting available to users, from simple reports about individual pupils to reports and analyses for cohorts of pupils in your school to complex whole-school analyses that deliver in a few mouse-clicks the key information you require to be able to complete your school’s Self-Evaluation Form (SEF).
The simplest way to experience the wealth of reporting available in CASPA is to download the free Evaluation Version of CASPA from our Downloads page and to explore what the system has to offer you; all of the reporting in CASPA has been designed to be simple and intuitive, and help is available at all times from CASPA’s extensive context-sensitive Help system which explains not only how to run each type of report and the options available, but also the kind of information the report might make available to you.
However, for those who just wish to get a quick impression of the breadth of CASPA’s reporting, a few examples of reports and their uses are given below:
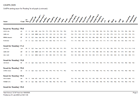 |
Improve the consistency of assessment using CASPA’s ‘Ranking report by aspect’: CASPA includes simple reporting to allow you to ensure the consistency of assessment within your school via the use of CASPA’s ‘Ranking report by aspect’. Ranking reports group together pupils scoring at the same outcome level for the specified subject, regardless of their age, their categories of need or the classes in which they are taught and allow inconsistent assessments to be quickly identified. For an example of CASPA’s ranking report, please click here. |
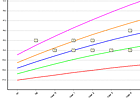 |
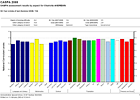
Ensure appropriate categorisation of pupils for bench-marking using CASPA’s percentile graphs: CASPA’s bench-marking model takes account of the age of the pupil, their level of prior attainment and their category of need; to ensure reliability in analysis, you need to have confidence that pupils have been assigned to appropriate categories of need; CASPA’s percentile graphs allow you to do this, as well as giving information about the spread of attainments within cohorts within your school. For an example of CASPA’s percentile graphs, please click here. |
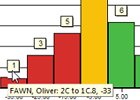 |
Comparing actual progress against expectations: CASPA provides sophisticated and powerful high-level reporting of the proportions of cohorts of pupils progressing better or worse than expected based on their age, category of need and level of prior attainment , and by how much their progress differs from expectations . CASPA’s reporting allows you to drill down instantly to identify individual pupils and the reasons they may be progressing better or worse than expected. For an example of CASPA’s progress versus expectations reports, please click here. |
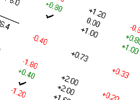 |
Comparing a pupil’s actual progress against their targets: CASPA allows you to compare a pupils’s actual progress against their targets in each aspect, and also to compare both actual and target progress against expectations based on age, category of need and level of prior attainment; this allows target-setting to be reviewed to establish whether targets for each aspect were excessively or insufficiently challenging for the pupil. For an example, please click here. |
 |
Reporting suitable for use with parents at a parents’ evening: CASPA includes a wide range of reporting about individual pupils that is suitable both for use at a parents’ evening, or for inclusion as part of annual reporting to parents. For a range of examples, please click here. |